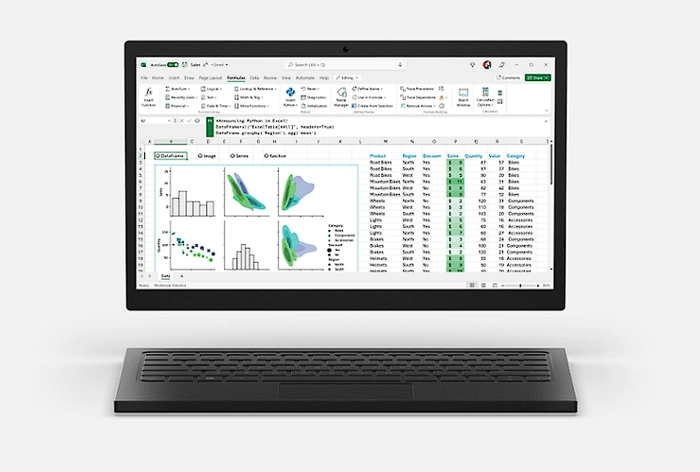
The recent announcement from Microsoft that they have now integrated Python into it’s Excel spreadsheet software has opened up a wealth of new applications for data analytics, automation and number crunching. This new integration approach allows users to seamlessly blend Python and Excel analytics within the same Excel grid, thereby creating an uninterrupted workflow. The result? A powerful tool that allows data manipulation and exploration using Python plots and libraries, coupled with the refinement of insights using Excel’s formulas, charts, and PivotTables.
The transformative power of Python in Excel lies in its ability to leverage Python libraries to clean up, explore, and analyze data right within the familiar, secure Excel environment. This feature is designed to cater to both experienced Python users and those just getting started, eliminating the need for any additional installations.
How to use Python in Excel spreadsheets
Python in Excel brings together the best of both worlds. It combines Python’s data analysis and visualization libraries with Excel’s features, allowing users to manipulate and explore data using Python plots and libraries, and refine insights using Excel’s formulas, charts, and pivot tables.
What are Python libraries?
They are collections of modules that provide functionalities, methods, and classes to perform specific tasks without the need to write code from scratch. These libraries can be seen as tools or extensions that you can use in your Python programs to achieve certain functionalities easily and efficiently. Here’s a breakdown of some key points :
- Modularity: Libraries often focus on specific areas, allowing users to choose the tools that best fit their needs. For example, there are libraries for web development, data analysis, machine learning, and more.
- Efficiency: Many Python libraries are optimized for performance, ensuring that operations are executed as quickly as possible.
- Community Support: Many Python libraries are open-source, meaning they are developed and maintained by a community of developers. This also means that they are continually updated and improved.
- Ease of Use: Python libraries often come with extensive documentation and examples, making it easier for developers to implement and use them.
To illustrate this process, the iris dataset, a popular data set in data science, is used. The first step in the analysis involves creating a data frame using the PANDAS library. In a strategic partnership with Anaconda, the company has ensured that versions of popular libraries are directly available in the workbook.
A dataframe named “DF1” is created via cell reference, using the new Excel function with an auto-generated headers parameter. The code can be outputted as a Python object or an Excel value. The PANDAS library is then used to understand the dataset, with functions like shape, info, and describe.
The dataset is cleaned by removing duplicates and outliers. Python plots are created to visualize and explore patterns, trends, and insights in the data. Histograms, scatter plots, and pair plots are used to visualize the data. Four different machine learning models are built, trained, and tested to predict flower species.
Excel’s formula logic and collaboration capabilities are leveraged to build models and share analysis. The analysis includes creating data frames, cleaning the data, creating python plots, and building predictive models, all within the Excel grid.
Python in Excel is revolutionizing the way data analytics is conducted. It offers a unique blend of Python’s data analysis capabilities and Excel’s features, providing a comprehensive tool for data manipulation, exploration, and insight refinement. For more information on using the new-integration in your Excel spreadsheets jump over to the official Microsoft 365 website.
Filed Under: Guides, Top News
Latest Aboutworldnews Deals
Disclosure: Some of our articles include affiliate links. If you buy something through one of these links, Aboutworldnews may earn an affiliate commission. Learn about our Disclosure Policy.


